
Over the summer I had an opportunity to work with the Ontario Marginalization Index which is a data model that has been developed and maintained by Public Health Ontario and the Centre for Urban Health Solutions at St. Michael’s Hospital. This data and supporting resources are publicly available on the PHO website. Using R, I downloaded this data along with shape files from Statistics Canada and created a tool to explore socioeconomic issues with interactive maps. My initial development of this tool was as an R Shiny dashboard. However, I replicated and expanded on this work in Power BI.
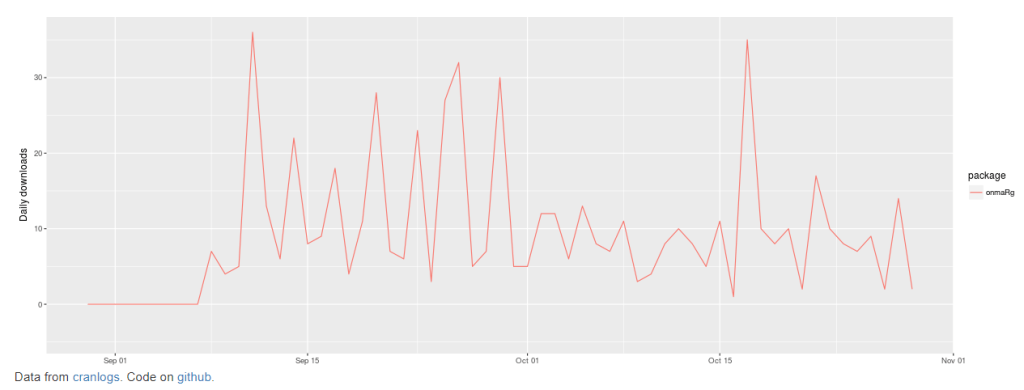
At the end of August I consolidated my R scripts into a set of functions and created the onmaRg package which was accepted by CRAN on September 8, and has been available for public use for almost two months. In that time, it has been downloaded 572 times (as of today), and is currently ranked 18362 of 18773 available packages in the CRAN ecosystem.
Resources that provide guidance on how to use the R package will be shared soon.
