
Although the generic maps available in in Power BI are useful, sometimes you have a project that uses its own geography. If you are working with ESRI or other shape
file formats, Power BI has a visual called “shape map” that gives you the capacity to add your own maps to a report, so you can show and interact with your data by area. The advantage of the shape map option is that you do not need to have an ESRI license. You do, however, need to format the .shp files in a particular way to make them accessible. This article provides a step-by-step walk through to get the benefits of your own geography in Power BI reports.
Getting the Correct Files
To begin, you will need a the shapefile and csv for your map. The shapefile will be used for the actual map, and the csv will be used to represent data on the map. The shapefile and csv will need some common column so that Power BI knows which value corresponds to which location. A quick way to get a usable csv is to convert the dbf to csv.
Converting File Formats

Power BI can only load topojson formats for a shape map, so first you will have to convert your shapefile to topojson. One way this can be done is by using QGIS. The next slides will show how to use QGIS to convert a shapefile to topojson.
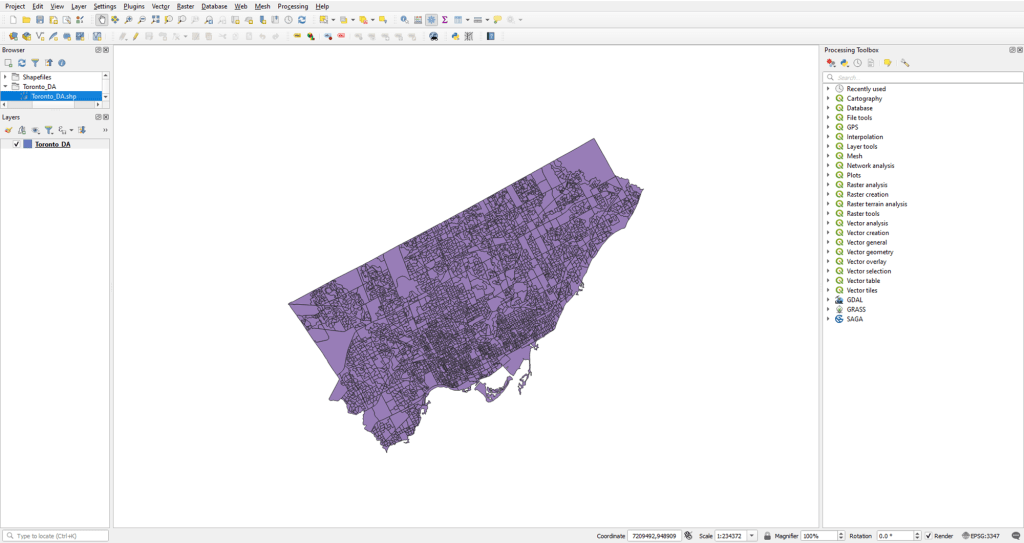
- Load your data into QGIS. The following example uses 2016 “Dissemination Area” shape files for Toronto from Statistics Canada.
***IMPORTANT***
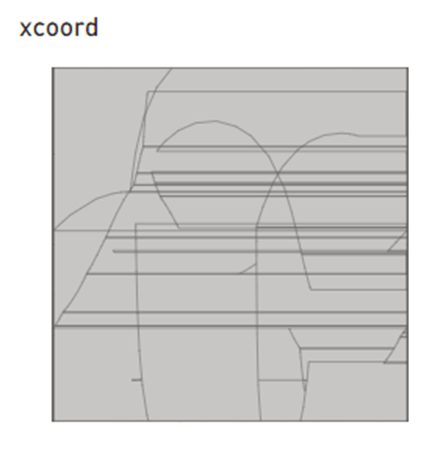
The conversion process that you will work through requires the ESRI .shp file you just loaded to be using the EPSG4326 coordinate reference system (CRS). If you are using a different CRS, your TopoJSON file will look unrecognizable.
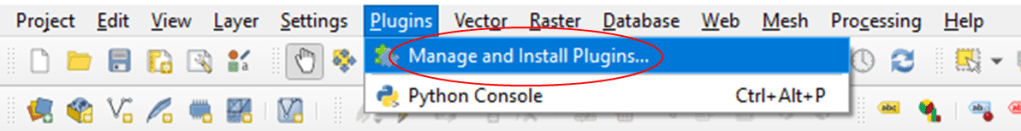
2. Click on “Plugins” and select “Manage and Install Plugins…”
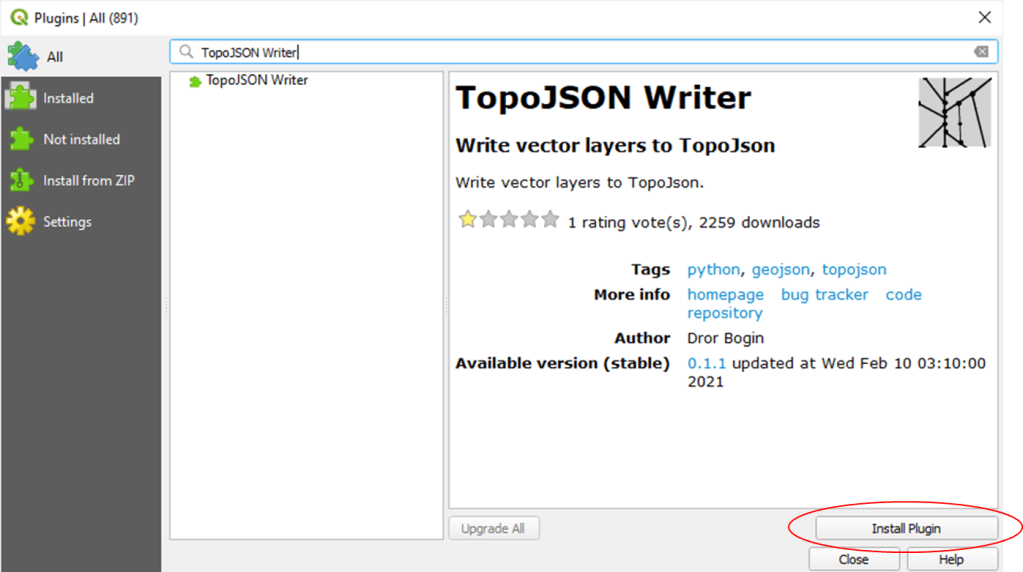
3. Go to “All” and find the “TopoJSON Writer” plugin and click “Install Plugin”
4. You may have to restart QGIS to see the plugin, but it will appear in the plugins area on your toolbar. Click on the TopoJSON Writer icon.

5. In the TopoJSON dialogue box, use the following settings:
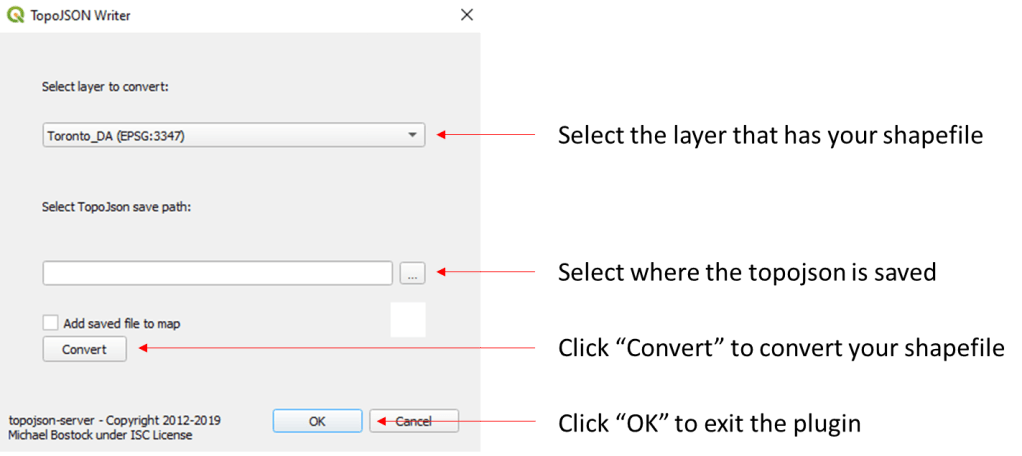
With your shape file converted, you are now ready to use it in Power BI, which will be the focus of the next post.
